Over the past few weeks I built a closed-loop wearable that tries to predict compulsive body-focused repetitive behaviors (BFRB) from physiological signals, then intervene with median nerve stimulation (MNS) before the behavior starts. The hardware (IMU, PPG, thermal, plus EMG as a labeling-only channel, on a Seeed Xiao ESP32S3) streams raw sensor data over serial to a Python pipeline that extracts anticipatory-window features and trains classical ML models (logistic regression, random forest, gradient-boosted trees) on a personalized, self-collected dataset.
The strongest, most reproducible finding was that heart-rate variability computed from a clean early segment of the lookback window was the only feature addition to clear 95% significance under paired bootstrap testing, and it held up again independently in follow-up experiments. Point estimates reached as high as 0.868 AUC, though I’d treat this more as a ceiling than a stable operating number given how small the dataset still is. A separate experiment also showed that a population-level prior actively hurt performance compared to personalizing from scratch, reinforcing that BFRBs seem specific enough to the individual that N=1 modeling is the right call here, at least for now. This write-up covers the prediction side, with closed-loop stimulation as the next phase.
Why
If you’ve ever popped a pimple, bitten a nail, or plucked an eyebrow, odds are that you never really thought twice about it.
But for every 1 in 20 of us, body focused repetitive behaviors (BFRB’s) like skin picking, hair pulling, and nail and cheek biting is something that affects us in ways we often keep hidden or silent from the people around us. Upwards of 20 million people in the US alone experience dermatillomania (excoriation/skin picking disorder) and trichotillomania (hair pulling disorder).
The impact isn’t only physical–open wounds, scars, or bald spots. It’s also emotional, with immense feelings of low self esteem, shame, guilt, and a loss of control over actions.
I grew up with a chronic motor tic and BFRB’s—frequently picking at my lips, face, or hands—since I was seven. And for the longest time, I was told to just stop, that it was only a bad habit. But there was more to it: I couldn’t just stop.
I kept thinking about what I could do to help me stop.
In sophomore year, I built a web-app that played 1 of n genz sounds if it caught you picking at your lip.
In junior year, I started building a mirror attachment device that would turn my mirror off if it caught me picking at my face. This January, I spent a week working on it a bit more before getting whisked away on some side quests.

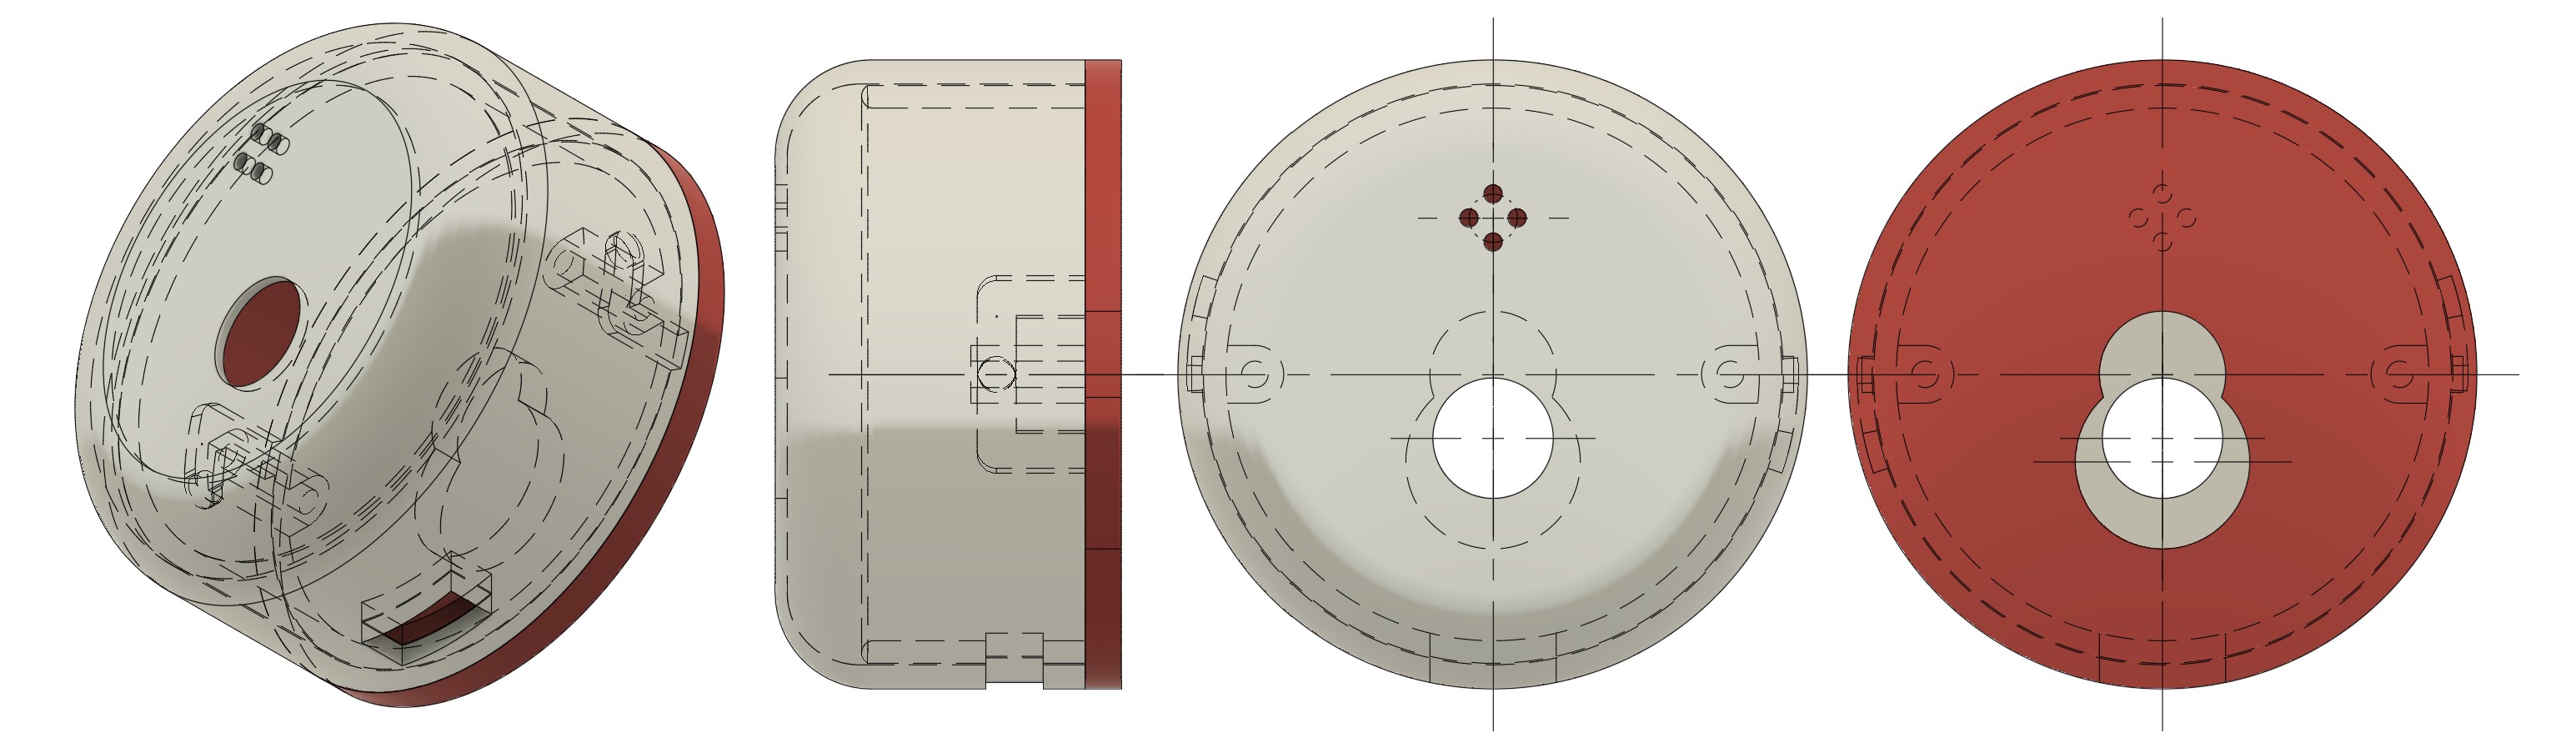
This summer, I thought I’d try to make something that would be more robust for people with BFRB’s. A wearable, perhaps, so that the intervention would exist on-body instead of in-environment.
Some wearables for a version of this already exist, most notably HabitAware and Pavlok. But besides some mixed reviews and high false positive rates, these mostly vibrate or shock the user to notify them of the behavior. They don’t actually stop the behavior at the moment.
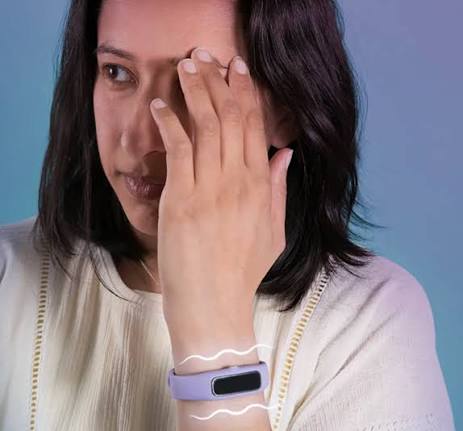
Research from the University of Nottingham showed that median nerve stimulation (MNS) could help significantly reduce the urge to tic in severe tics or people with Tourette’s Syndrome. Stimulating the median nerve with small, rhythmic electrical pulses to the skin at around 10-12Hz sends signals up the arm to modify brain activity via mu-band entrainment. This resetting phase synchronization and boosting inhibitory oscillatory power in the sensorimotor cortex
Both conditions, Tourette’s and BFRB’s, seemed to be influenced by the cortico-striato-thalamo-cortical, or CSTC, circuit in the brain. It’s a circuit involved with movement, habits, learning, impulse control, and more. Mu-band entrainment helps regulate the CSTC circuit by resetting phase synchronization and boosting the strength of inhibitory oscillations in the sensorimotor cortex. This is the mechanism believed to help reduce severe tics. And if BFRB’s seemed to be caused by a dysregulation of the same circuit, I was curious to see whether entrainment would help BFRB’s as well. Some conversations, including one with Prof. Stephen Jackson from the University of Nottingham, pointed in the right direction that “it should work.” (The general vibe behind these conversations was a, “we don’t know the details of why these things work, but they do, and we should be able to cross-apply solutions to other conditions/things”)
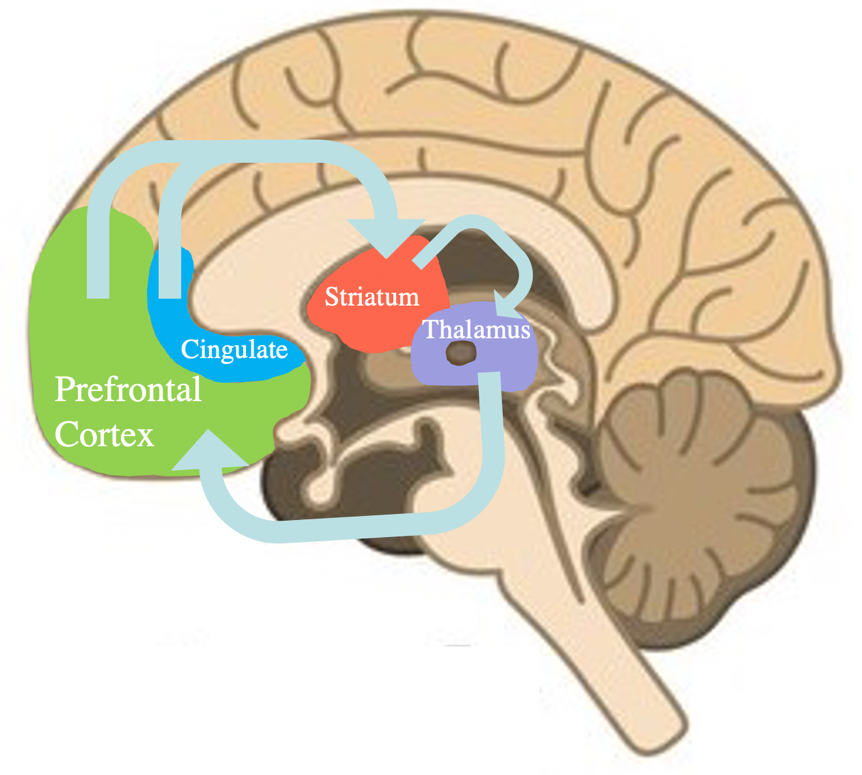
But I also thought it’d be annoying if I had to manually turn the stimulation on everytime. I’m often not even aware of my picking. Besides both being affected by the CSTC circuit, BFRBs and tics also share a common structure: there’s usually a physiological ramp-up (restlessness, autonomic arousal, and/or a specific movement signature) before the behavior itself, and a brief window where an external interrupt—a vibration or stimulation pulse—can derail the urge before it finishes. Except this time, I wanted to replace the interrupt with a preventative stimulation signal to stop the behavior before it ever starts.
A closed loop system seemed like an interesting approach, and I found this research on the predictive side that showed that hand-crafted features plus classical ML on wrist sensors could hit 0.89-0.94 AUC predicting these episodes on a small dataset across 10 people. That research was the inspiration for what this project became.
This hypothesis then involved two parts: a sensing (input) side and stimulation (output) side.
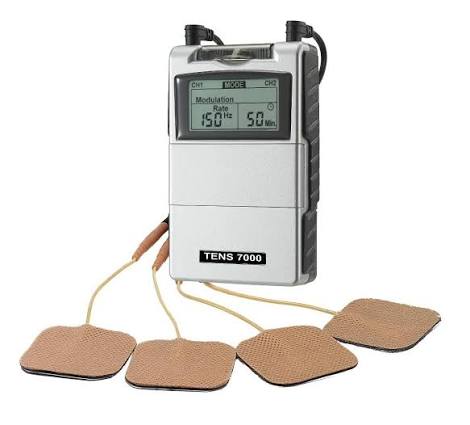
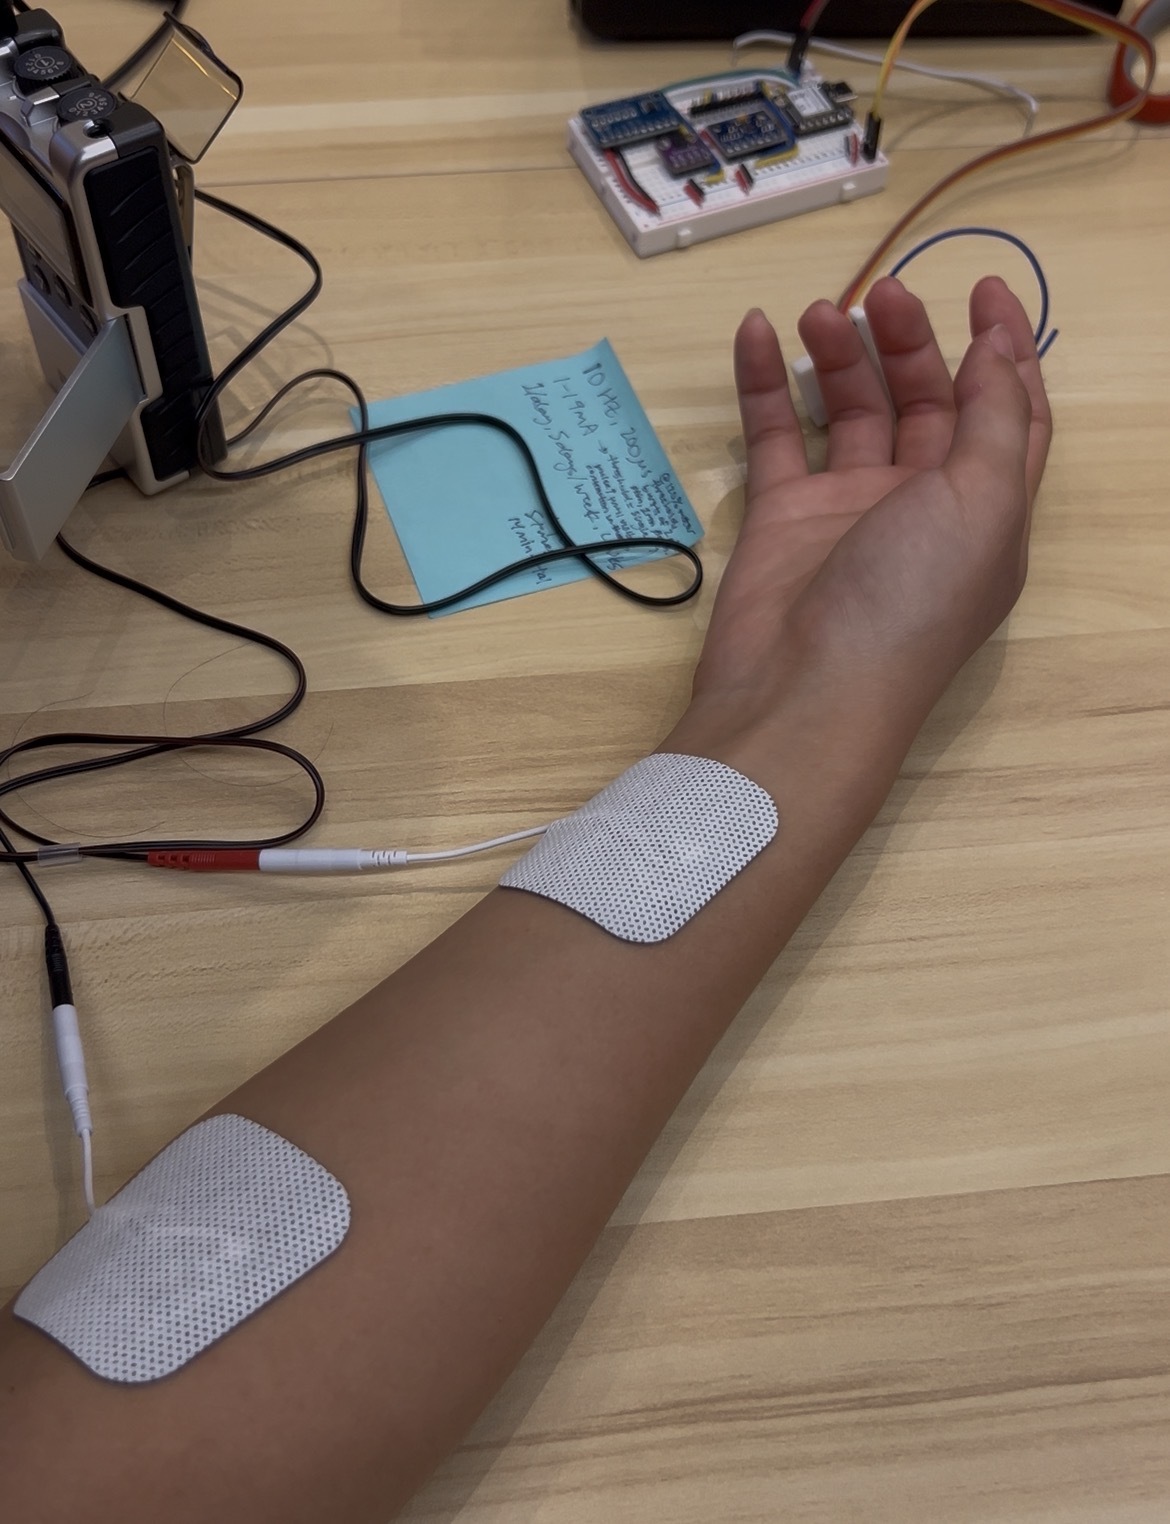
On the stimulation side, I bought a TENS unit. If it worked on myself, I’d recreate the stimulation with a biphasic circuit of my own afterwards. But in the meantime, it was time for an informal lab rat test (unfortunately difficult to run a study of this on myself when the condition/event is often subconscious). I ran it on Normal mode at 10Hz, 200μS, at 2 minute bursts each time with 30 seconds in between, based on the Nottingham and WashU papers.
On the sensing side, this is what I built.
Hardware Spinup
The prototype is built around a Seeed XIAO ESP32-S3. I used the following sensors for the bulk of it. They were selected based on sensors used in the Cambridge sensing paper, and they’re quite standard for your classic white label health/wrist wearable. They give the extra flexibility I wanted with raw sensor data.
- IMU (MPU6050): wrist motion, the primary signal for the repetitive-movement signature itself.
- PPG (MAX30102): heart rate and, eventually, heart-rate-variability (HRV) as an autonomic-arousal proxy.
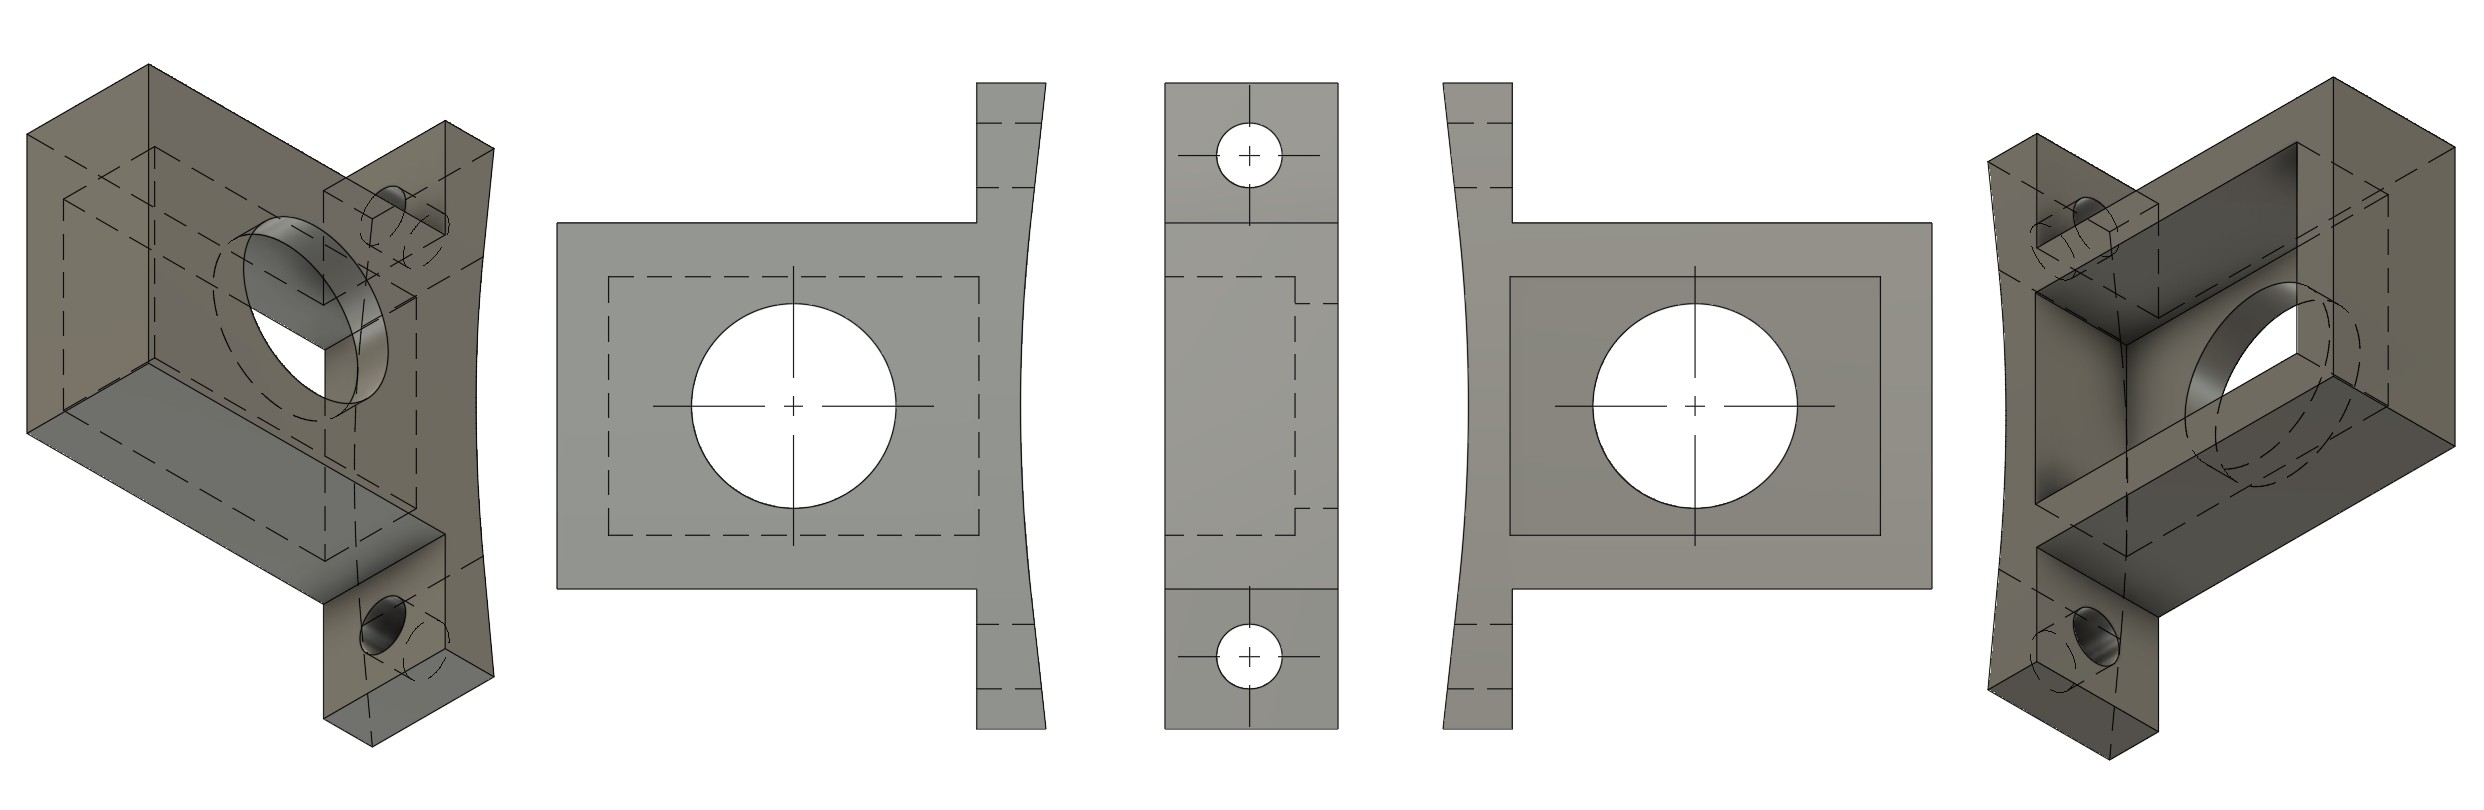
- Thermal (MLX90614): ambient and skin temperature, a cheap secondary physiological channel. I designed a small holder for the sensor to better position it on my wrist.
These three share one I2C bus and get read together on every tick, which matters later (see Packet serial stream).
I also tried adding two other sensors for more information:
- EMG (MyoWare 2.0 + Kendall electrodes, thenar placement) as a more accurate labelling instrument for the future. This was partially inspired by my previous project on EMG sensing. It ran on its own, separate I2C bus so its timing doesn’t mess with the shared IMU/PPG/thermal bus. Because the EMG outputs an analog signal, and because the Xiao ESP32S3 internal 12-bit ADC is too noisy and low-resolution sufficient to read it, I routed it through a 16-bit ADS1115 ADC. Note, I’d recommend buying Myoware Cable Shield along with the sensor cable (that splits into three snap connectors). This makes it much easier to place the electrodes on your hand for the thenar placement.
- EDA (electrodermal activity / skin conductance) as a fourth channel of info. I wired it up but then pulled it back out for the 3-sensor IMU+PPG+thermal setup. It’s still in git history commented out, in case it’s worth revisiting once there’s a clearer signal.
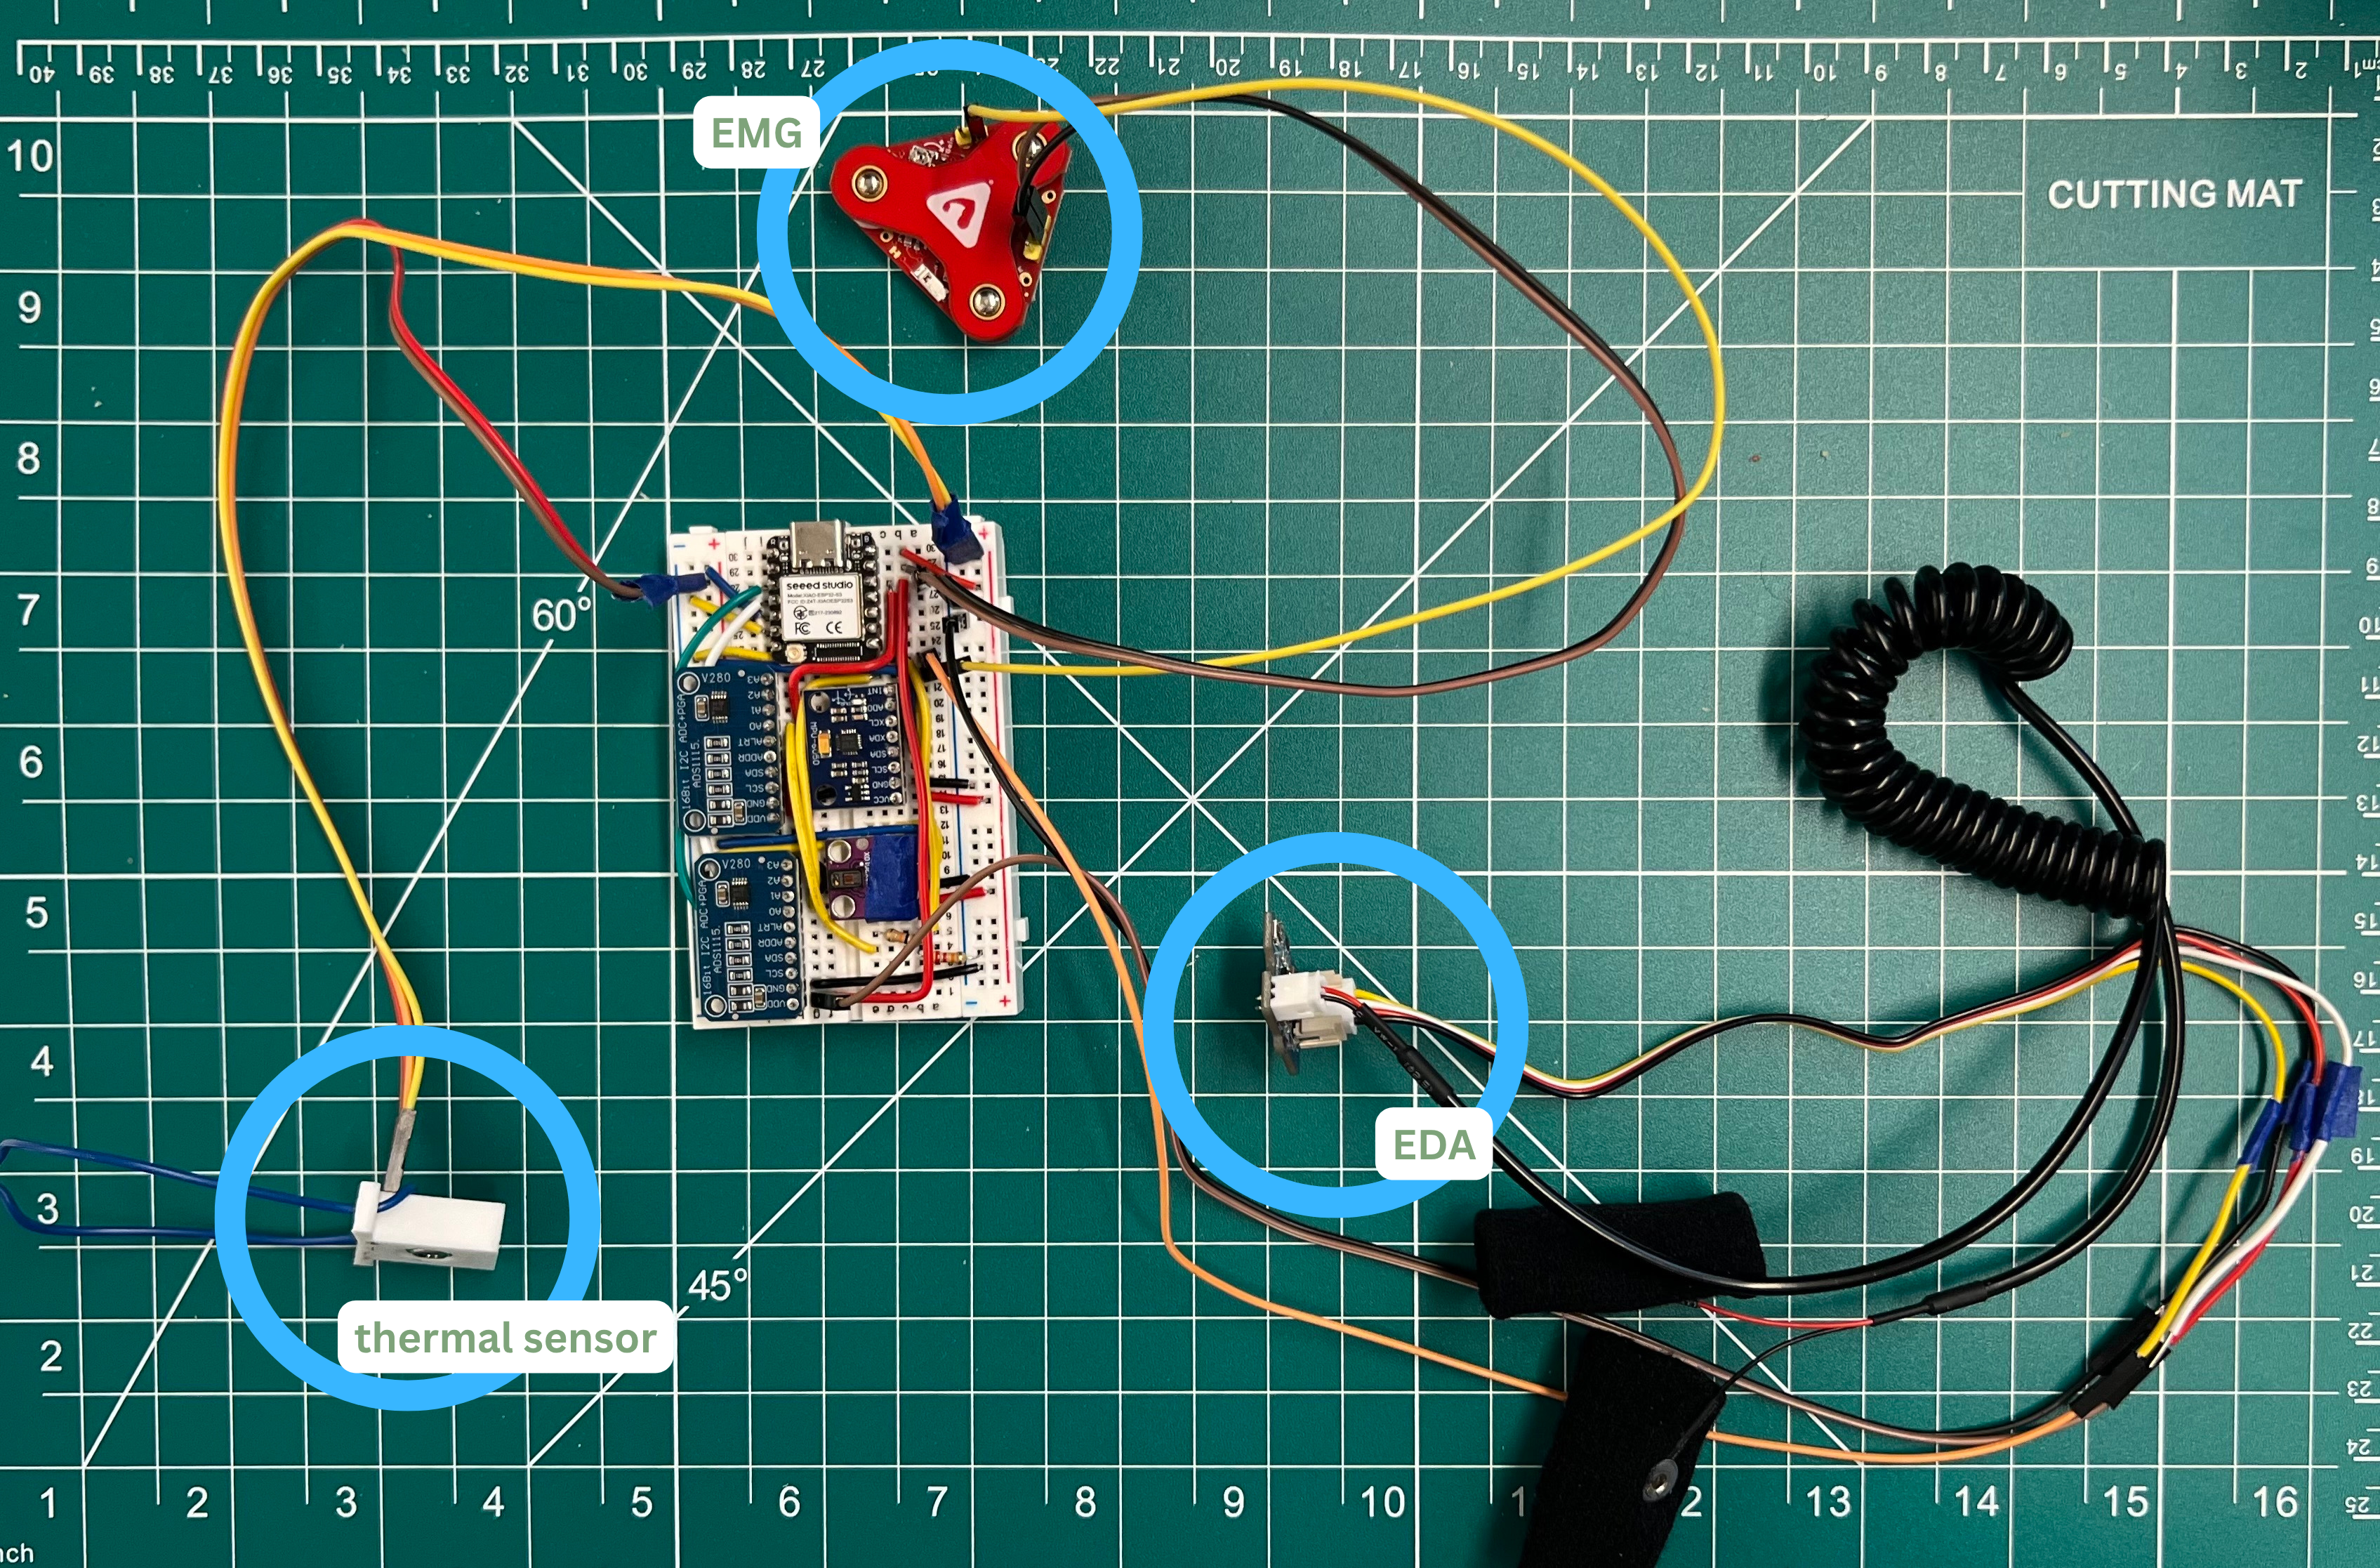
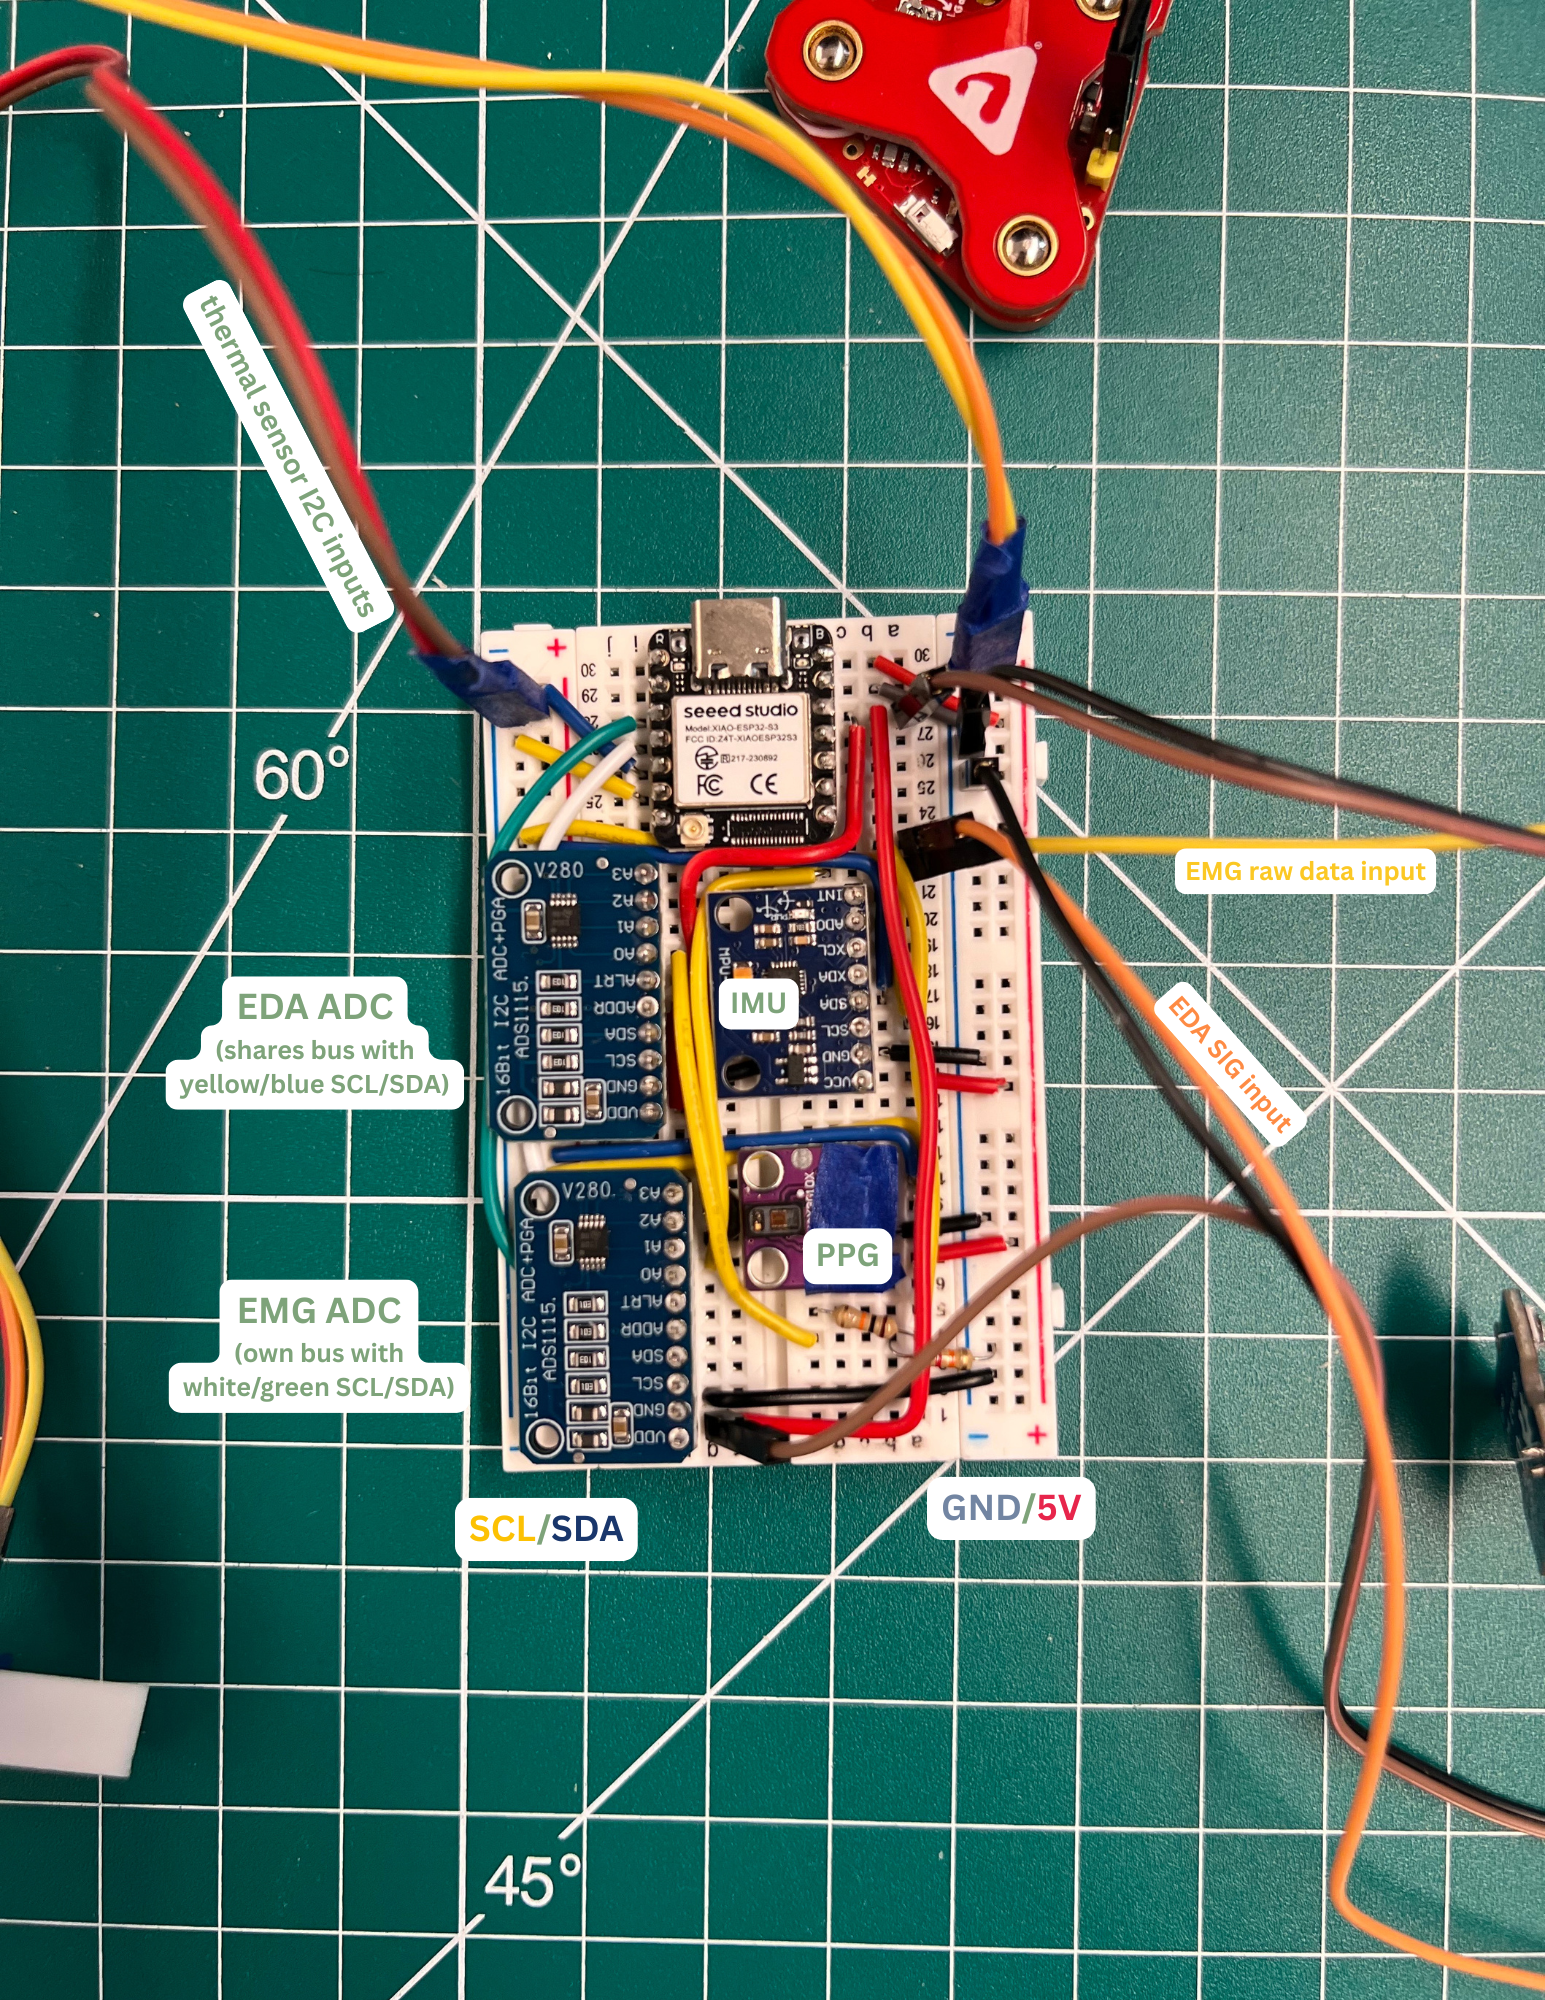
Here’s a flow chart of the setup:
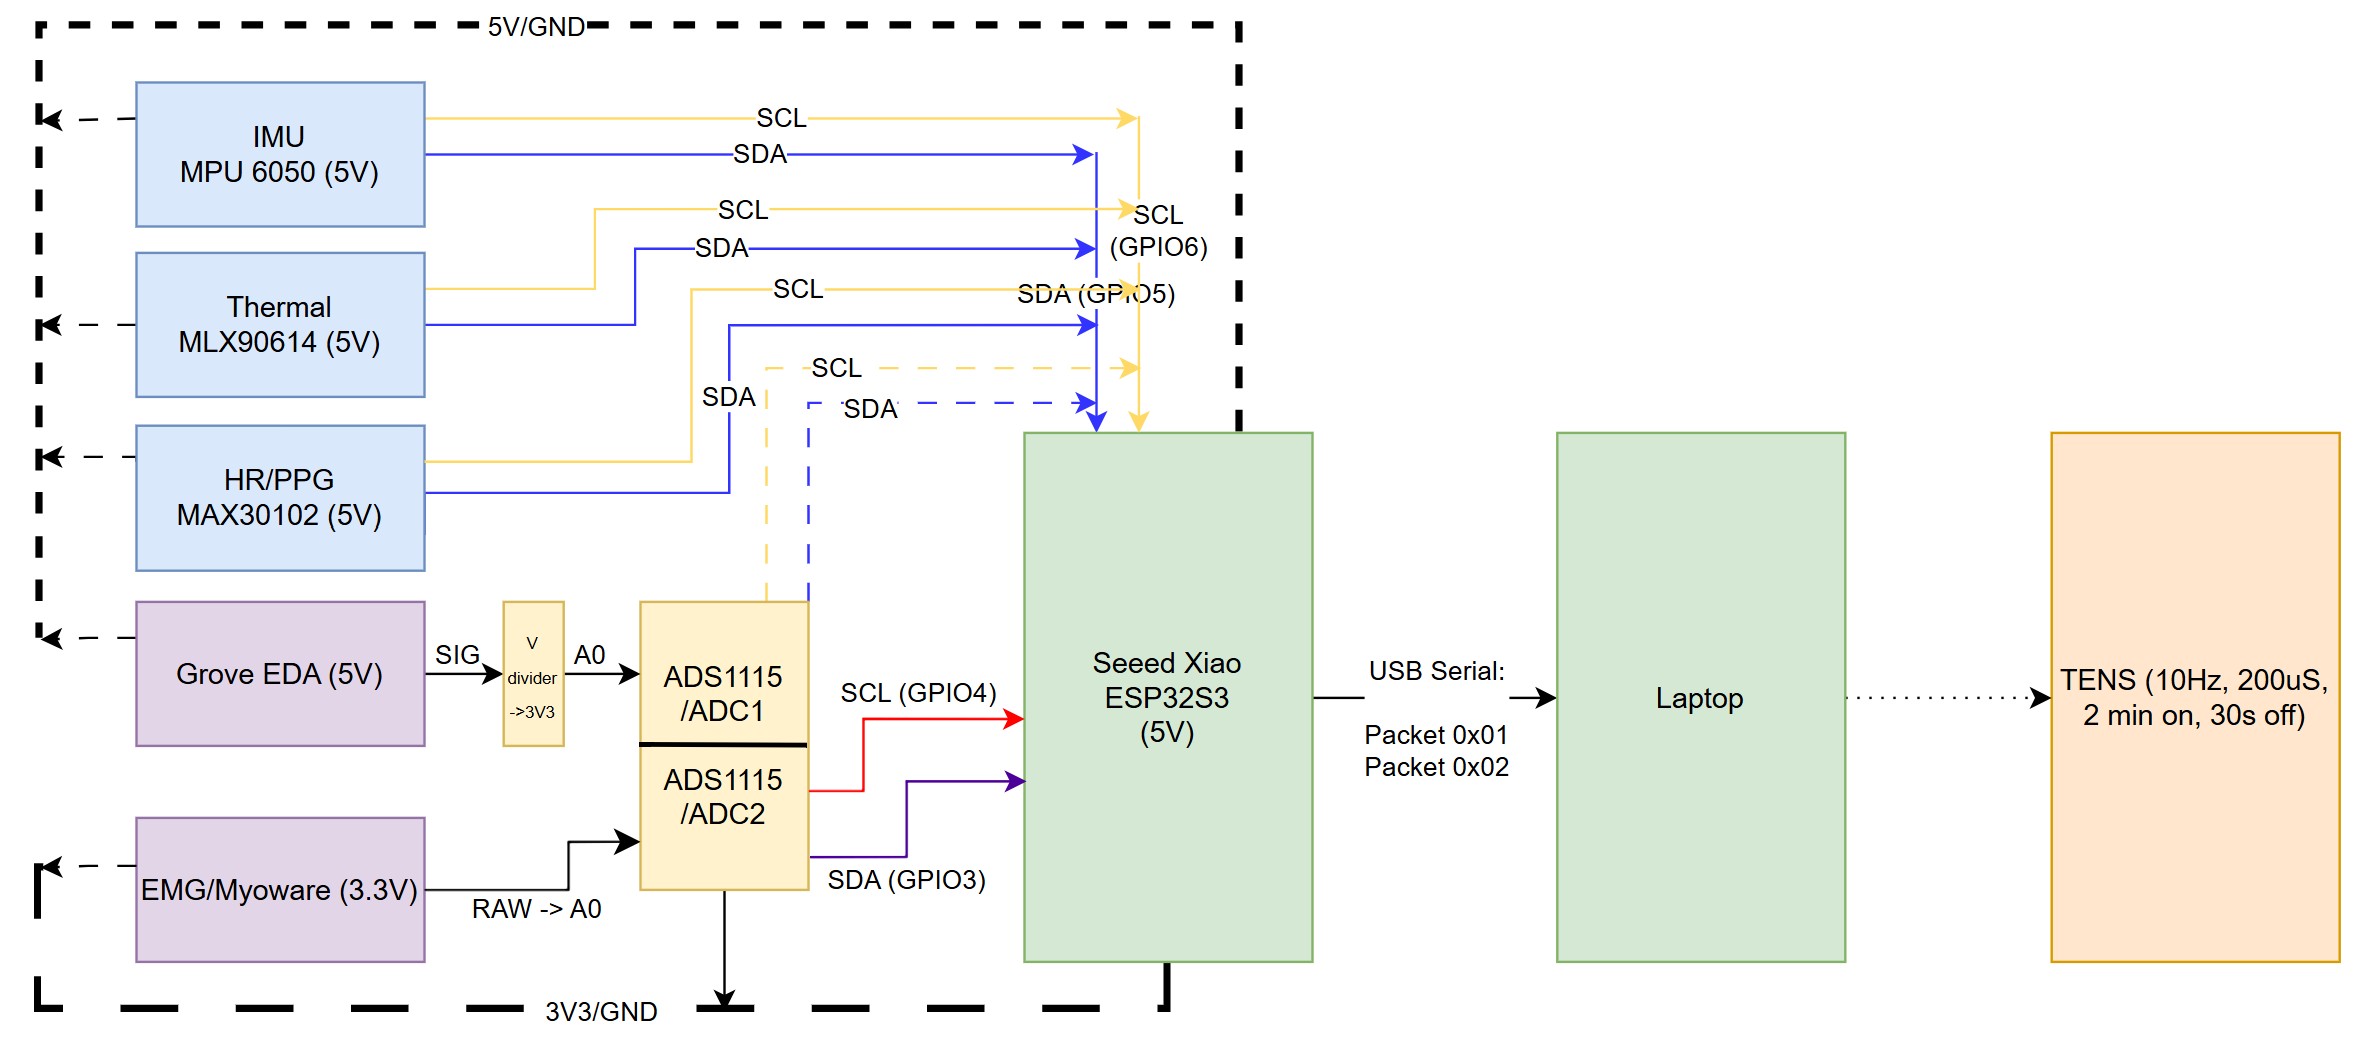
To keep the hardware side light, the firmware sends sensor raw data in framed packets over serial with no inference or filtering logic. This way, I could keep things simple on the microcontroller side and focus on the model side, while collecting as much data as possible. Two packet types share a line, with both having a version byte and framed with 0xAA start and 0xBB end bytes so old and new sessions don’t get ambiguous later.
- The IMU + PPG + thermal packet: Type
0x01with 37 bytes; since the 3 sensors share a bus and get read together, they’re packed into a single packet per tick at 50 Hz. The accelerometer/gyroscope is packed as a scaled int16s, PPG IR/RED as raw 32-bit FIFO values, ambient and skin temperature as floats, along with an XOR checksum and the end marker. - The EMG packet: Type
0x02with 11 bytes; the EMG sensor is packed at 500 Hz, with a single raw ADS1115 reading per packet. For now, this isn’t streamed live (it’s used offline withemg_candidate_flagger.py) (see Data Collection), since the labeling hardware wouldn’t ship on a later version of the device.
Both packets ride the 921600-baud serial line. The host-side receiver scans the serial stream for the 0xAA start bytes, reads the type byte, and dispatches to the right fixed-length reader. With the framing bytes and fixed-length binary brackets riding the baud line, there’s the off chance risk of a dropped byte, torn packet, or a stray start byte. The XOR checksum is a cheap integrity check so that a packet is dropped if it doesn’t match. The sensors that share a clock domain are packed into one packet so that the host doesn’t have to reconcile independent timestamps after.
This data is sent over wired USB serial to limit connectivity bugs and focus on the sensing/modeling side. The host-side receiver.py opens the port, decodes packets, and writes three files per session: a raw .bin of concatenated packet bytes, a .meta.json with session timing/counts, and a .markers.csv of any keypress events during recording.
Pipeline and Training Approach
My Procedure
To collect data, I taped the device to myself, recorded a session, logged ground-truth events during the session, reviewed afterwards, retrained, and repeated over about a week and a half. I recorded sessions whenever I had extended periods of time at my desk–if I ever needed to walk around, I’d bring my laptop with me (functionally the battery for this setup). I averaged ~17.5 picking events/session (range: 8 to 27) at around ~16.5 events/hour across 245 windows over 5 days of data collection.
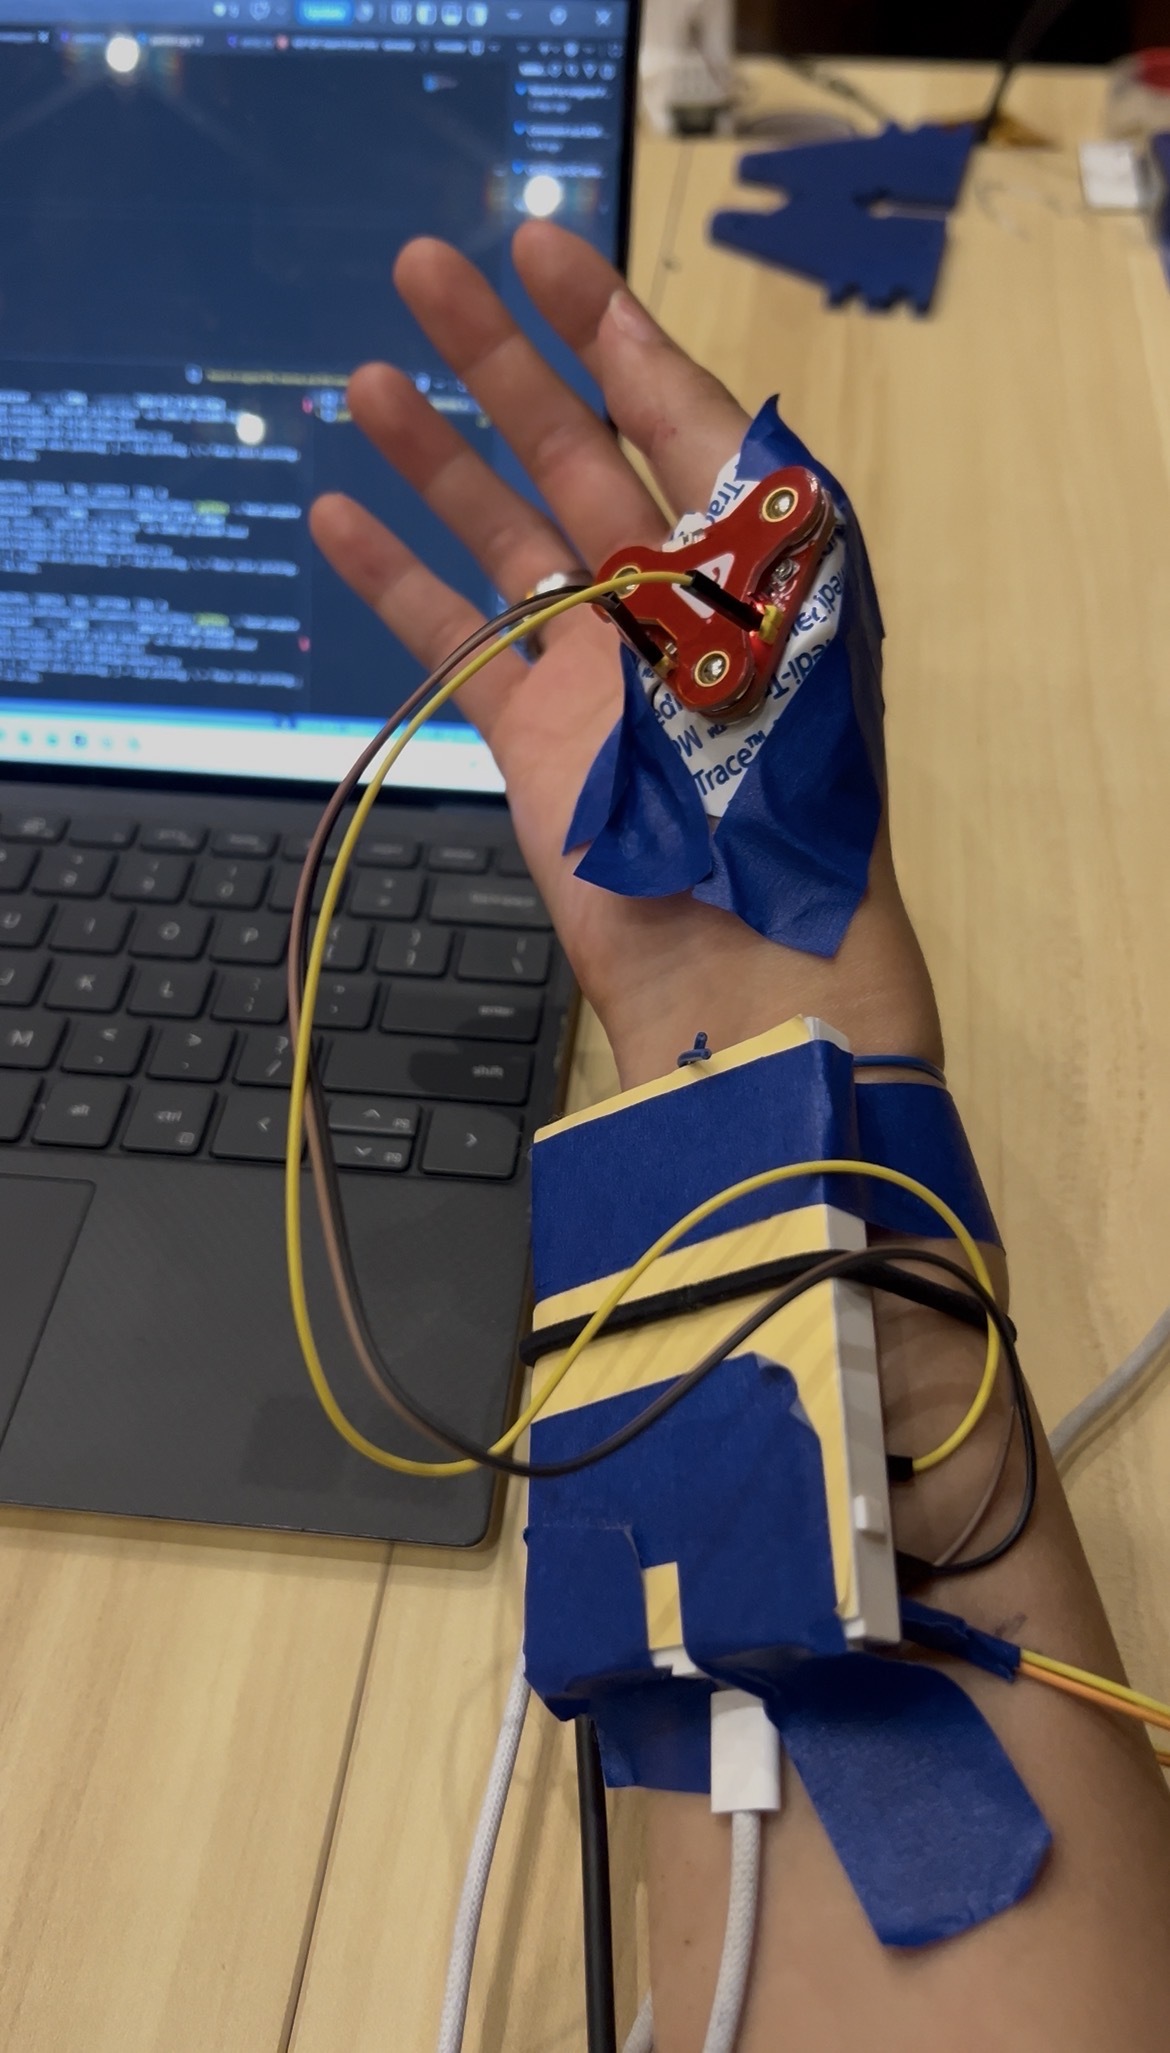
During the session, I set specific hotkeys for three different BFRB behaviors ([ = skin picking, hand; ] = lip picking; \ = skin picking, face) to log which behavior happened. Every timestamp—across sensor data and keypress markers—is in the ESP32’s millis() clock domain, not the laptop’s host wall-clock time. This way, there’s only ever one clock in play, which prevents the possibility of any drift, timing errors that creep into the labeled windows, or the need for lining up two independent clocks afterwards.
There are two concurrent labeling paths: a fast self-report path (keypress markers during free-living wear) and a slower, more objective path. For the latter, emg_candidate_flagger.py scans a session’s EMG channel, builds a smoothed rectified envelope, and thresholds it into candidate windows. review_tool.py then plots each candidate against the IMU/PPG/EMG traces and asks for a human accept/reject/adjust. The keypress timing is still the default, though, while there wasn’t time to review every session by hand.
I had thought about collecting data the same way the Cambridge paper had by video recording and retroactive labelling. But doing so was even more time and storage intensive to warrant watching back every session video in full length while building and iterating on this solo. The EMG-flagger approach only surfaces candidate windows for a quick human accept/reject, which was going to be at least a slightly smaller review burden per session.
From there, everything reads from one shared module (host/pipeline/).
The data was segmented into positive and negative windows. Positive windows were anticipatory lookback windows of {30, 60, 180} seconds up until a buffer of {3, 5, 7} seconds prior to the event, so the model could learn to recognize pre-event states. The buffer was added to absorb any lag from the self-reported keypresses. Negative windows were sampled separately from stretches that didn’t overlap any positive interval, count-matched to the positives. Features were extracted from the raw data: per-axis time-domain stats (mean, std, min, max, RMS, zero-crossing rate) and frequency-domain stats (dominant frequency, band power) on the 6 axes of the IMU, plus PPG-derived heart rate (mean/std/min/max via bandpass-filtered beat detection). HRV (RMSSD) was also computed, but is NaN by construction for any window under 5 minutes because of how it’s calculated
Model Training
Based on research in this space, I started with simple models: logistic regression, random forest, and gradient-boosted trees, compared via day-based leave-one-group-out cross-validation. Each fold holds out a full calendar day so that random splits wouldn’t leak across overlapping windows from the same session and inflate scores. And since day-specific factors like mood, sleep, caffeine intake, sensor placement, and stress are constant within a day, holding out whole days keeps folds from having those factors correlate with the label across the split, which scattered-window splits wouldn’t guarantee.
Each fold also fits its own StandardScaler on that fold’s training data only, so no cross-day leakage into normalization stats either. The best model by mean CV AUC gets a final fit on all days but the most recent, evaluated once on that held-out day, and saved.
Then, build_dataset.py walks every recorded session, expands each marker into its anticipatory lookback window, extracts features, and writes one flat features.npz (X, y, day-group labels) for training.
The reproducible baseline—logistic regression, full feature set, day-based CV—sits at AUC 0.596 ± 0.104, barely better than chance, with a confidence interval wide enough to swallow “chance” entirely. Every number below is compared against that, not against whichever run happened to look best that day.
The following four feature sets were tested:
- Baseline: compute_features()’s accel/gyro output unchanged (54 features: mean/std/min/max/rms/zcr/dominant_freq/power_0_5hz/power_5_15hz per axis) in a single 60 second window.
- Multi-horizon: (A)’s feature computation applied independently at three window lengths (30s/60s/180s), all ending at the same anticipation point (event_start - buffer_ms), concatenated into a 162-feature vector per sample
- Enriched single-window: (A) + jerk (d(accel)/dt) time-domain stats (mean/std/min/max/rms/zcr per axis, 18 features) in a 60 second window, 72 total.
- Enriched multi-horizon: (B) + jerk at each of the three window lengths, 216 features total (72 x 3, w30/w60/w180_ prefixed).
Across nearly 170 tested configurations over the course of this project—different model types, window splits, feature variants, and attempts to augment data—the best cross-validation point estimate came from random forest on a richer feature set, landing at 0.868 AUC. The feature set consisted of the following:
- Feature set D
- 3-second pre-event buffer
- Clean-early-segment HRV (RMSSD/SDNN computed from the first 90 seconds of the 180s window) added on top.
But given the relatively small amount of data, I’d take this more as a snapshot than a real operating point. Here are some small clips of testing the model.
What the data showed & Learnings
| Configuration | Model | CV AUC | Compared against | 95% CI of the difference | % resamples favoring it | Significant at 95%? |
|---|---|---|---|---|---|---|
| Baseline — full feature set, no additions | LR | 0.596 ± 0.104 | — (reference floor) | — | — | — |
| Highest point estimate — Set D (multi-horizon + jerk), 3s buffer, + HRV | RF | 0.868 ± 0.083 | baseline | overlaps baseline’s CI | — | ❌ not confirmed |
| Best statistically-supported config — Set D, 3s buffer, + HRV | LR | 0.821 ± 0.091 | same config, HRV vs. no HRV | [+0.0048, +0.0482] | 100% | ✅ yes |
| + HRV — Set B (multi-horizon), 3s buffer | LR | 0.820 ± 0.061 | same config, HRV vs. no HRV | [+0.0055, +0.0412] | 98.0% | ✅ yes |
| + Clean-segment HRV — original single-window baseline | LR | 0.732 → 0.761 | same config, HRV vs. no HRV | [+0.0045, +0.1173] | 98.6% | ✅ yes (first to clear the bar) |
| Shorter pre-event buffer, 7s → 3s — single-window baseline | GBT | 0.641 → 0.669 | 7s buffer | [−0.050, +0.162] | 94.8% | ❌ just short |
| + Thermal channel | GBT | 0.641 → 0.550 | no thermal | [−0.117, +0.108] | 26.8% | ❌ no (leans toward hurting) |
| + Thermal channel | LR | 0.632 → 0.569 | no thermal | [−0.135, +0.087] | 31.4% | ❌ no (leans toward hurting) |
| Population-prior shrinkage, λ=1 → 1000 | LR | 0.580 → 0.443 | 36-feature baseline (0.571 ± 0.092, no prior) | overlaps at every λ (e.g. λ=1 bootstrap: [0.384, 0.698] vs. baseline’s [0.374, 0.740]) | — | ❌ no benefit, and gets monotonically worse as λ increases |
Paired bootstrapping told a more honest story than the marginal confidence intervals had. Comparing baseline vs. each candidate on the same resampled days—instead of independently—canceled out a shared “some days are just easier” noise, and there was a slightly more real directional signal underneath (77–95% win rates for several candidates) that the marginal CI’s had been hiding. But in the original sweep, only one candidate actually cleared 95% significance: heart rate.
Computing HR/HRV features from just the first 90 seconds of the 180-second lookback window—instead of the whole thing—kept 95.5% of windows usable, versus near-chance performance everywhere else motion artifact got involved. Adding RMSSD/SDNN on top of that moved CV AUC from 0.732 to 0.761, and the paired bootstrap put the improvement’s 95% CI at [+0.0045, +0.117]—the only comparison in the original sweep to exclude zero, if barely. This is promising!
The cardiac-HRV lead held up under follow-up, too. Stacking the sweep’s best feature sets (multi-horizon 30s/60s/180s windows, with and without jerk) on top of the 3s buffer, then adding the same clean-segment RMSSD/SDNN features back in, pushed the best point estimate to 0.868 AUC (up from the sweep’s original 0.819) — and the HRV addition itself cleared 95% significance again, independently, on both multi-horizon feature sets, for logistic regression specifically (CIs [+0.0055, +0.0412] and [+0.0048, +0.0482], 98–100% of paired resamples favoring it). This does seem to be specific to the linear model, though: adding HRV did not clear significance for random forest.
A shorter pre-event buffer also seemed like a second promising signal. When I swept across 7, 5, and 3 seconds, 3s came out ahead at 0.669 AUC vs. 0.641 AUC for a paired bootstrap against the 7s baseline put 94.8% of resamples in 3s’s favor, just short of the 95% significance line, with a CI of [−0.050, +0.162] that still (barely) spans zero.
Thermal data unfortunately doesn’t help—it’s likely too slow and noisy of a signal. Adding it in dropped CV AUC in both GBT (0.641 → 0.550) and LR (0.632 → 0.569). A paired bootstrap put the difference at [−0.117, +0.108], so it’s not a confirmed regression but not a signal that helps either, with only 27–31% of resamples favoring keeping it in. Skin temperature likely lags autonomic arousal too slowly to be useful in a seconds-to-minutes anticipatory window.
Personalized data also clearly beats out generic. I ran a separate experiment fitting a population prior on the public 10-subject BFRB dataset from the Cambridge/Nokia paper, then tried shrinking my personal model toward it. Performance degraded monotonically the stronger I made the prior, and some of the population coefficients even pointed the opposite sign from what my own data supports. My best guess is that BFRB’s are specific enough to the individual that building for one person beats building for a population, at least here.
Running a data collection and model training pipeline on myself was its own kind of interesting, especially given what I was collecting. It’s hard and very noisy/biased, obviously. Hotkey-pressing after a behavior I’m often not even aware of was difficult. They’re fast to collect, but the timing isn’t precise, and I’m sure it added some extra behaviors and bias I wouldn’t have had otherwise, and I’m sure I missed some presses too. When there’s time to run it at scale, I suspect the EMG-flagger-plus-human-review pipeline would produce cleaner ground truth.
On the hardware side, isolating the timing-sensitive buses mattered more than I expected going in—putting EMG on its own bus kept its 500 Hz poll from stepping on everything else. That said, I don’t think reinventing the hardware layer is where the real moat is. I used sensors that are already standard in white-label wearables; unless there’s some new sensor tech that unlocks something, the differentiation has to live in software.
What’s Next
There’s a lot more that can be done with this project: refining the sensors, collecting more data, working on the output (stimulation) side.
Refining the Sensors via Part Selection and Form Factor
Collecting more Data
###
Broader Reflections
The Path of Lowest (technical) Risk
While this was an interesting experiment, I still want something I can use in my daily life for my most acute picking situations. To be honest, skin picking is the version I personally care most about, since its consequences have been most long lasting and impactful. So, I’ve gone back to Dot Reflections
Working on things out of obligation for your younger self
I was geeked to work on this.
It was surreal to work on a project for a problem I’ve spent so many years thinking about. It’s what I thought I’d be building towards all throughout college, learning about hardware, healthcare, consumer, and more. At some point a couple years ago–the last time I ever made a “10 year plan”–this project was part of years 5-7 of that plan.
And then I worked on it now.
There were times when I felt like I was in flow state. I learned a lot!
But I also felt this weird feeling, like I wasn’t rolling downhill. My energy wasn’t naturally moving towards this on its own without me forcing it to. There was sometimes a sense of, “this is it”?
And at a certain point (and after numerous conversations with friends, mentors, and my dad), I realized what it was. I was doing this project out of obligation for my younger self.
Four years ago if you told me I’d be here working on this project, I’d be so geeked. Heading into MIT, it was all I ever really wanted. But I grew over the past four years. I learned new information about myself and the world.
I enjoyed working on this project. I learned a lot and had fun doing it. But my energy didn’t flow towards it in ways it does for a really fun project or unexpected side quest.
And when I didn’t feel the energy flow that way, the pace of work slowed. I was a bit frustrated with myself. Am I just being lazy? Am I just not gritty enough right now? Don’t I owe it to myself to see these things through?
But our guts know the distinction between these two categories; between “I want to see this through, and I enjoy this through thick and thin and there’s nothing else I’d rather be doing,” and “this is genuinely not meant for me, and what I thought this would be like is not actually what the experience is like at all.” And we have the agency to step out.
I think about the life metaphor from The Courage to be Disliked—life is a series of dots that looks like a drawn line from afar. You can’t plan for what the line will look like at the end. You can only place each dot as you live then, looking back, see the line that’s formed on the page. I’ve learned this deeply from improv; we can have an idea of how life, a semester, or a scene will go, but beyond a general direction no amount of planning will allow us to predict our futures.
Founder stories are rarely planned the way they are told to investors before the building happens. Successful actors could rarely tell you how their careers were going to go. When we tell others of our stories, we craft and package them neatly looking back, connecting the dots to explain how we got to where we are.
For me, the hard part was in applying that to how I place my next point. The point that we’re on now. I’ve laid this dot because, in some sense, I felt like the me from 20 dots back would have wanted me to. But just because you’ve laid out a series of dots doesn’t mean you owe the line anything. You don’t need to lay out a third dot to form a linear path with your previous two points. You just lay out your next point in the direction you’d like to go.
For people who experience menstrual cycles
For the past 22 years, having school–or any form of structured
This was one of my first times having a longer period of time with unstructured, self-directed work. Depending on how you experience your cycle, your luteal phase will unearth things your gut intuitively feels. Sometimes that will come to your brain as “I need to dump these projects immediately,” but sometimes the takeaway is a little less severe. I’m learning to better discern what the message is each time, but I’ve been heavily inspired by Chloe Zhao here on working with the seasons instead of against them.